

Racecard Structure
SharpBetting racecards are of similar design to racecards provided by other sources. Basic information includes the race time, course, race name, TV channel, distance, going and class of the race.
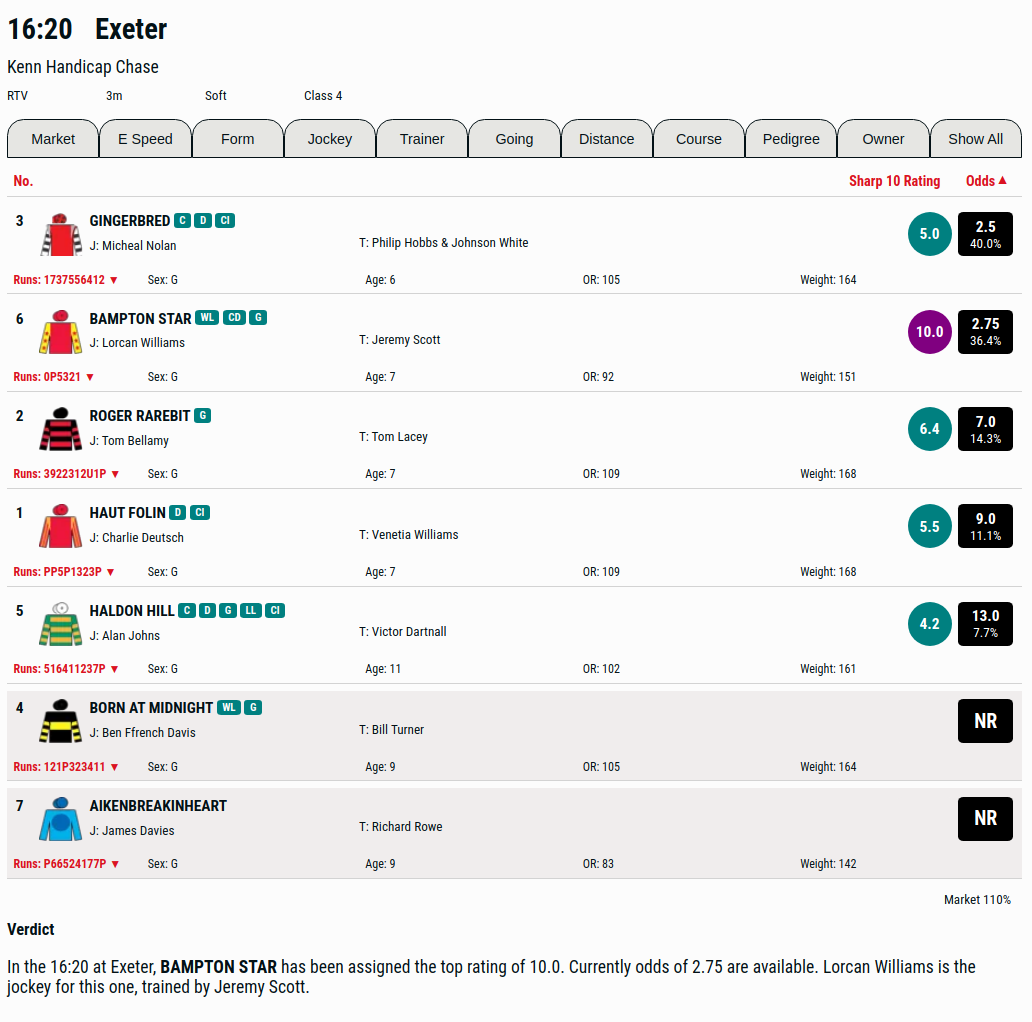
For each horse we provide the number, draw (if flat race), colours, horse name, jockey, trainer, sex, age, official rating, weight carried, current odds and the 'Sharp 10 Rating'. There are also flags for:
- Won Last Race
- Won at Course and Distance
- Won at Course
- Won at Distance
- Won on Going
- Won at Class
- Lead Early Last Race
For each runner we also provide horse history (runs), market history, and our bespoke ratings and statistics for market, early speed, form, jockey, trainer, going, distance, course, pedigree and owner. This information can be view by clicking on the required grey tab at the top of the racecard. To view all the information at once click 'Show All'.
Horse History
Clicking on 'Runs' for any any horse reveals up to 10 of the last performances it has had under rules in Britain and Ireland.
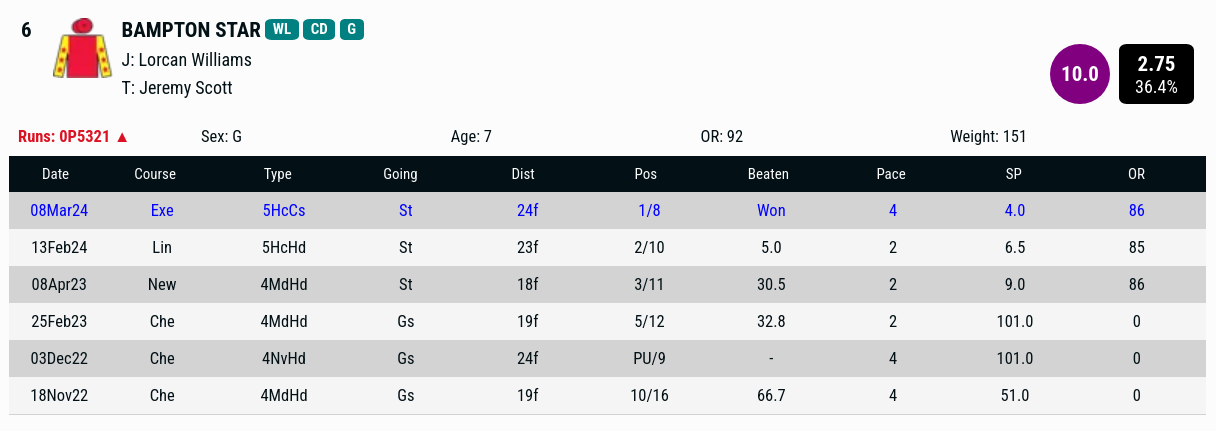
For each previous race it shows the date, course, type (this has class, if race was handicap, maiden etc, and if it was over hurdles, chase, flat turf or flat all weather), distance, position, how far the horse was beaten, early pace of the runner, starting price and official rating. The text is blue for any races the horse won.
Market
The price is the most important factor when deciding whether or not to have a bet. A horse that is a good bet at 5.0 might nolonger be worth having if the price is 1.8. Price movements are also key to betting on horses. If a horse is heavily backed it might mean the punter should reassess the chance he or she thinks that horse has of winning. SImilarly if a horse drifts hugely in the market it might mean connections have little confidence in it.
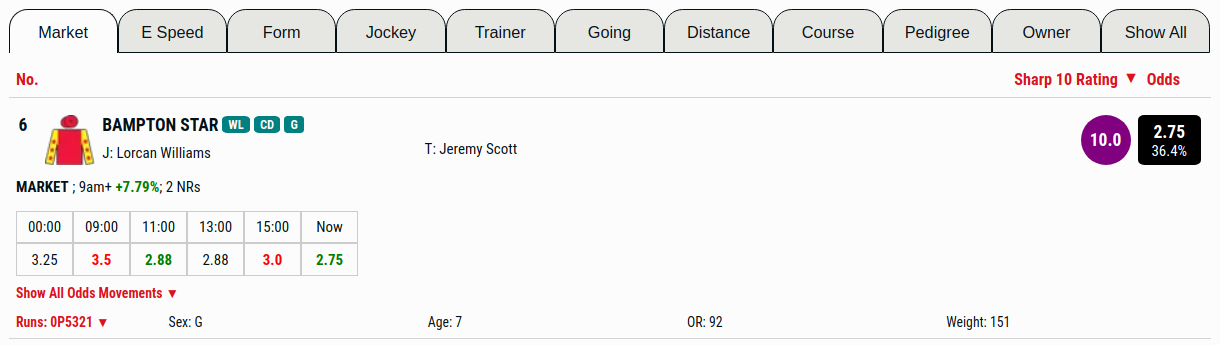
We capture the current market price of every horse from the night before racing. In order to get a consistent price we use the price that at least 3 of the major bookmakers are offering. This way we do not monitor the noise of rapidly moving individual prices are best prices.
Prices are all given in decimals. This is the dividend returned to winning punters including stake. 100% divided by the decimal odds gives the percentage in the book for each horse. For example, a horse with odds of 2.0 is 50% of the book (100%/2). We give the implied percentage below the current odds in the black odds box.
The odds at 6pm the night before racing, 9am on the day of racing and the current price are the key prices we monitor. We show the difference in the in implied percentage between these different times.
In the example above Art Decco was 3.0 (33.3%) at 6pm the day before racing. Currently he was 5.0 (20%). The odds movement implies that the horse has a 13.3% less chance of winning now (33.3%-20%). This figure is written in red text to the total movement to show that the horse has drifted.
For the individual times where odds are given if the horse drifted in the horse the text is red and if it shortened the text is green.
More granular price movements are available by clicking on the 'Show All Odds Movements' link.
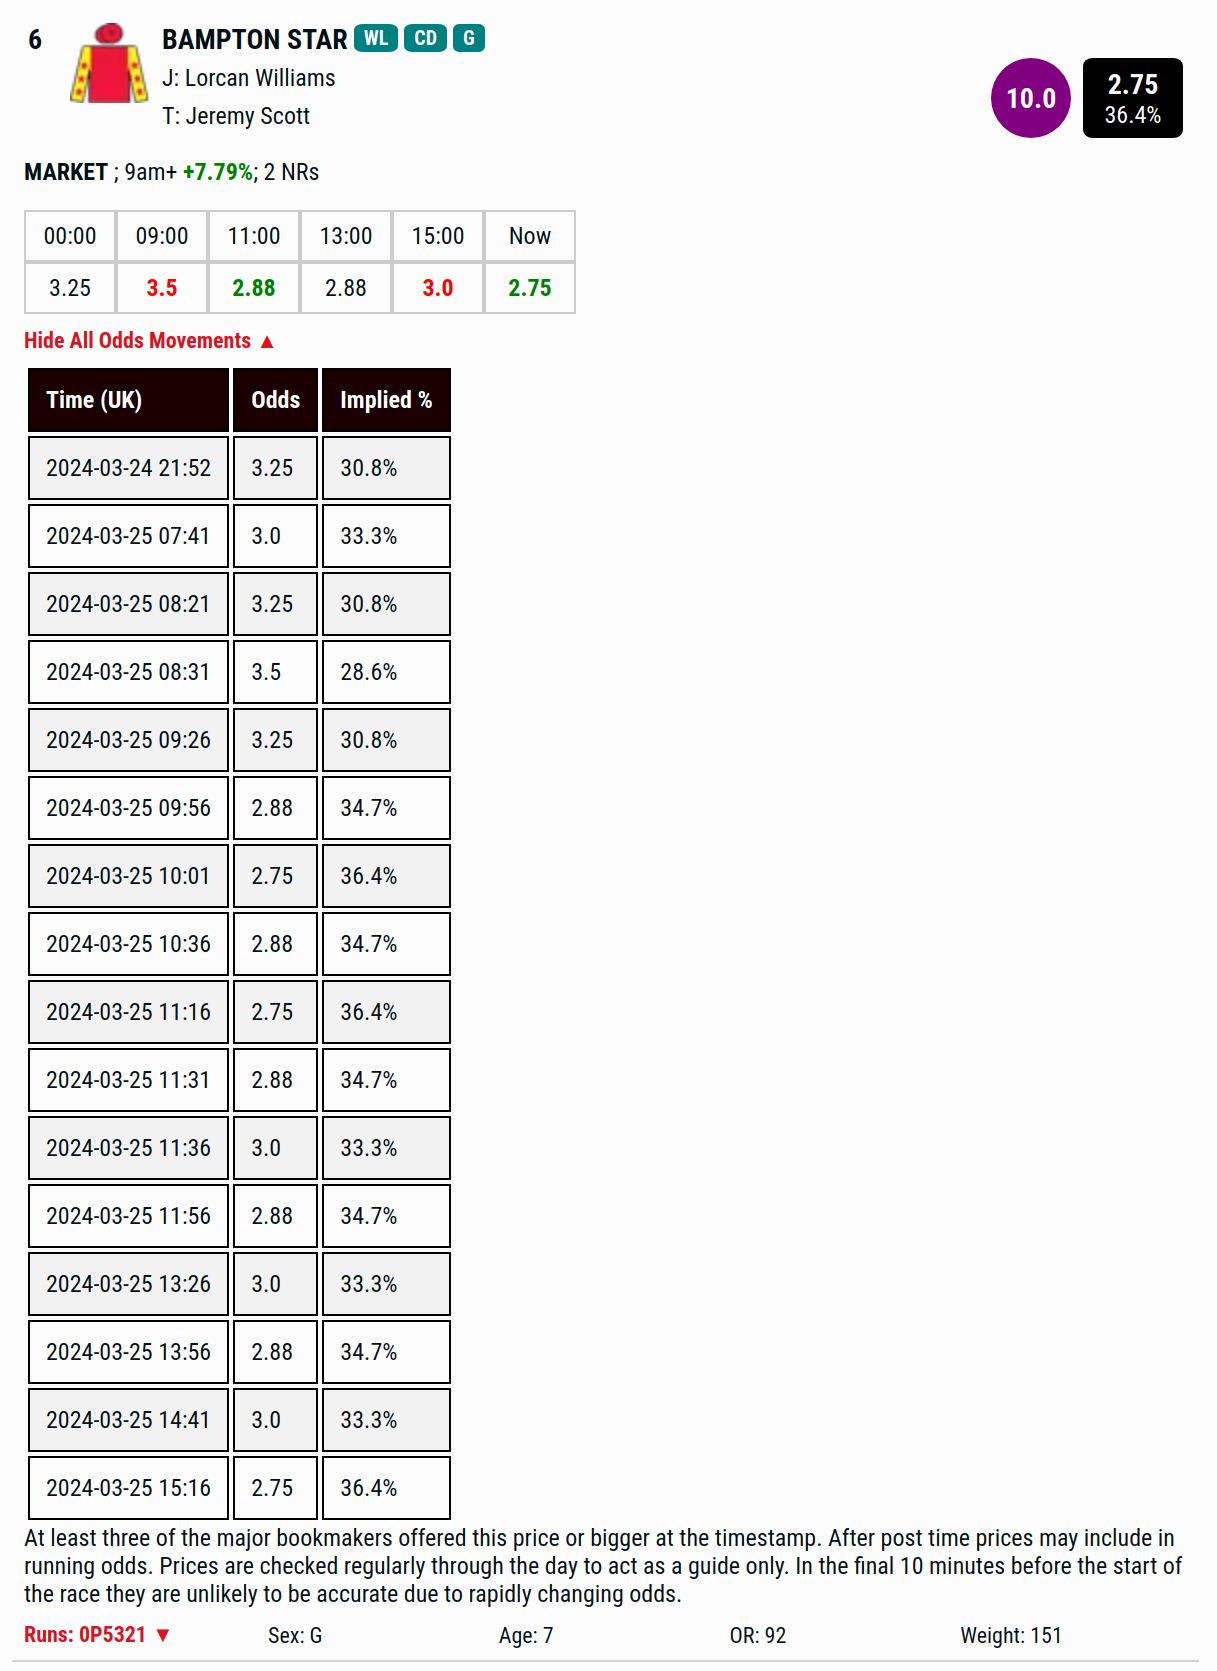
Prices are checked regularly through the day to act as a guide only. In the final 10 minutes before the start of the race they are unlikely to be accurate due to rapidly changing odds.
Early Speed
We have developed four categories of where the horse was in the early stages of its previous runs:
- Was at the front (Led)
- Prominent or close up (Prom)
- In the middle of the pack (Mid)
- Held up at the back of the field (Back)
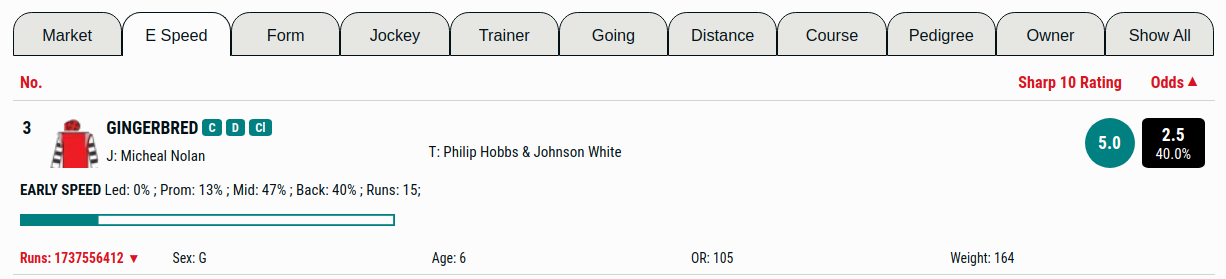
The total number of runs the horse has had in UK and Ireland is given as 'Runs'. In the example above this was 11. The percentage of those runs that the horse had in each category is given.
The teal line represents the rating given by our bespoke algorithm for the likely early speed for the horse in today's race. This is calculated from assessing all of the horses' previous runs, the jockeys and the trainers and predicting how each horse is likely to run given the opposition in this race. The bigger the teal bar the more likely the horse is to lead early. A small bar means the horse is likely to be held up.
Form
The form algorithm considers all the runs of every runner in the race. Factors such as number of win, class, race type, official ratings, weight, number of runs are included. The horse with the biggest teal chart is the one the algorithm rates the best on form.

Additionally, for each horse, we provide the win percentage, place percentages and total number of runs for all runs, today's class and the type of race today.
Jockey
The jockey algorithm looks at the jockey for every runner. Factors such as recent hit rates, overall wins, prize money, ability at the course and performances with today's trainers are taken into account. All the jockeys are then compared and rated.
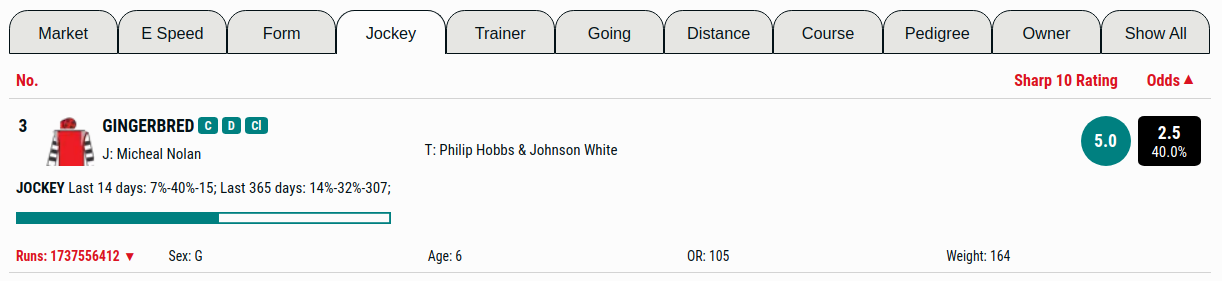
For each jockey we also provide the win percentage, place percentage and number of rides for the last 14 days and last 365 days.
Trainer
The trainer algorithm compares statistics for every runner in the race. Overall and recent performances of their runners are taken into account along with the trainer's record at the course. All the trainers are then compared and rated.
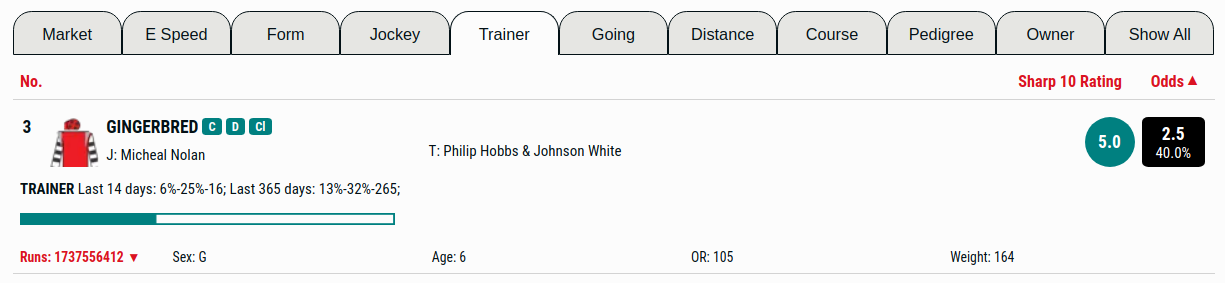
For each trainer we also provide the win percentage, place percentage and number of runners for the last 14 days and last 365 days.
Going
The going algorithm looks at every horse's performance at different ground conditions compared to today's ground. If the horse has not run at the going pedigree data on the going is considered. Again the horses are compared to see who is likely to run the best on today's going and rated on this basis.
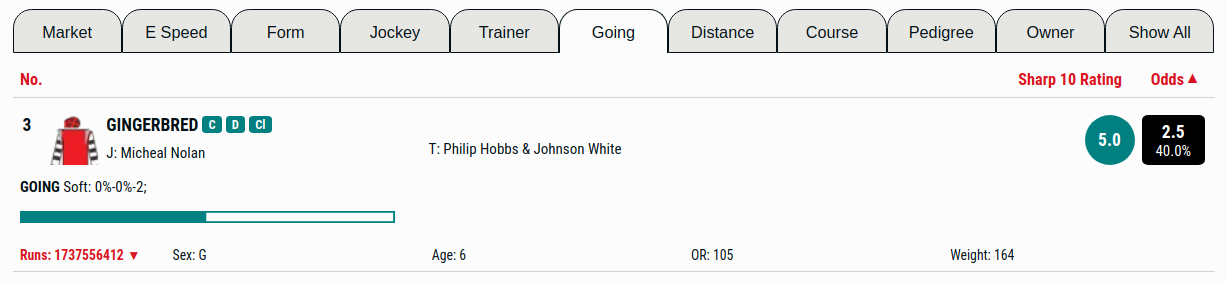
The win percentage, place percentage and total number of performances the horse has had on today's going is given.
Distance
The distance algorithm looks at every horse's performance at different distances compared to today's distance. If the horse has not run at the distance pedigree data on the distance is considered. Again the horses are compared to see who is likely to run the best on today's distance and rated on this basis.
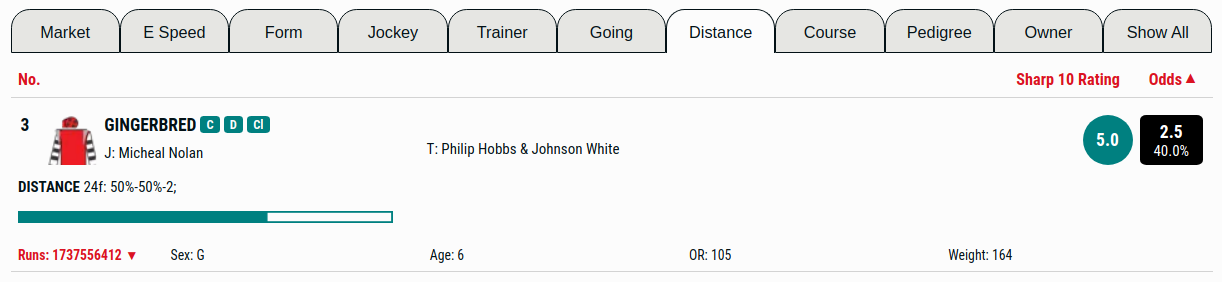
The win percentage, place percentage and total number of performances the horse has had on today's distance (rounded to the nearest furlong) is given.
Course
The course algorithm looks at every horse's performance at today's course.Trainer and jockey data on the course is also considered. Again the horses are compared to see who is likely to run the best on today's course and rated on this basis.
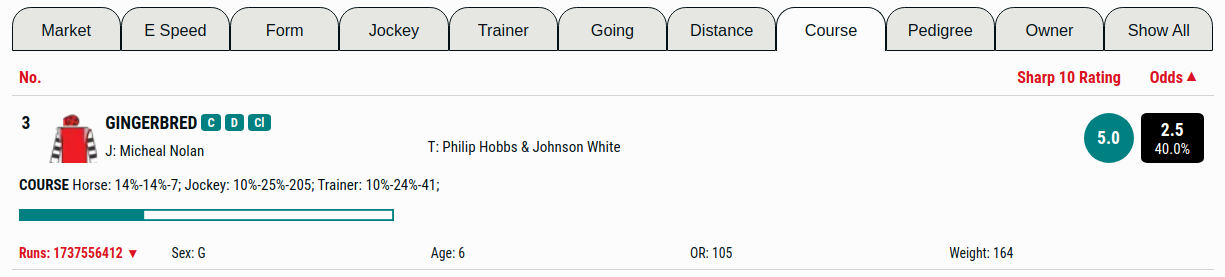
The win percentage, place percentage and total number of performances the horse, jockey and trainer has had on today's course is given.
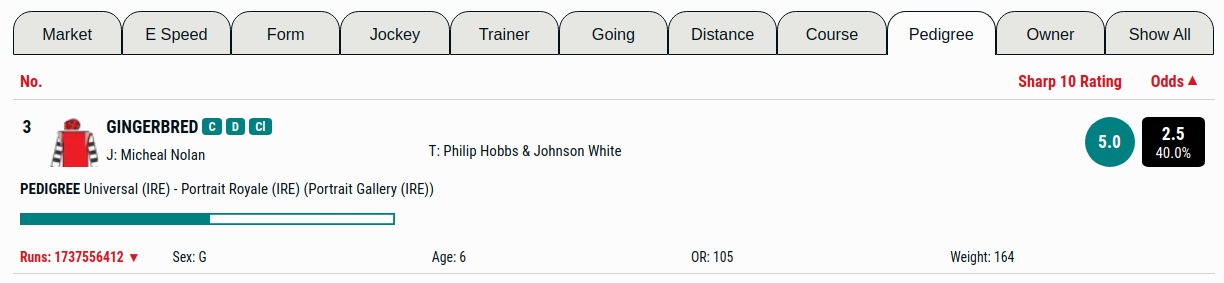
Pedigree
Sire, dam and damsire data for every horse is fed into an algorithm to predict which horses will run the best today. This prediction forms the rating in the teal bar.
Owner
The owner algorithm compares statistics for every runner in the race. Overall and recent performances of their runners are taken into account. All the owners are then compared and rated.
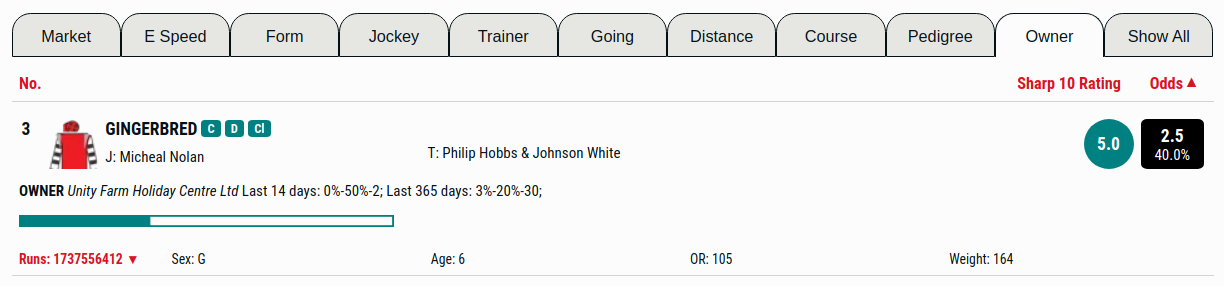
For each owner we also provide the win percentage, place percentage and number of runners for the last 365 days.
Sharp 10 Rating
The Sharp 10 Rating is calculated by feeding all the information that contributed to the individual ratings above (with the exception of early speed and market) into an algorithm. The result gives each horse a rating out of 10.
The Sharp 10 Rating is originally calculated over 36 hours before the race. It is updated if there is a non-runner and at midnight on the day of the race to take account of any new stats from the previous day's results.
The Sharp10 Rating is designed to be a pure rating unrelated to bookmaker odds. It is published well before the bookmakers offer prices on the race in most cases (sometimes bookmakers price up big races days in advance). Combined with market information it can provide the user with clues as to what might be a good bet.